2.1. Plant Material
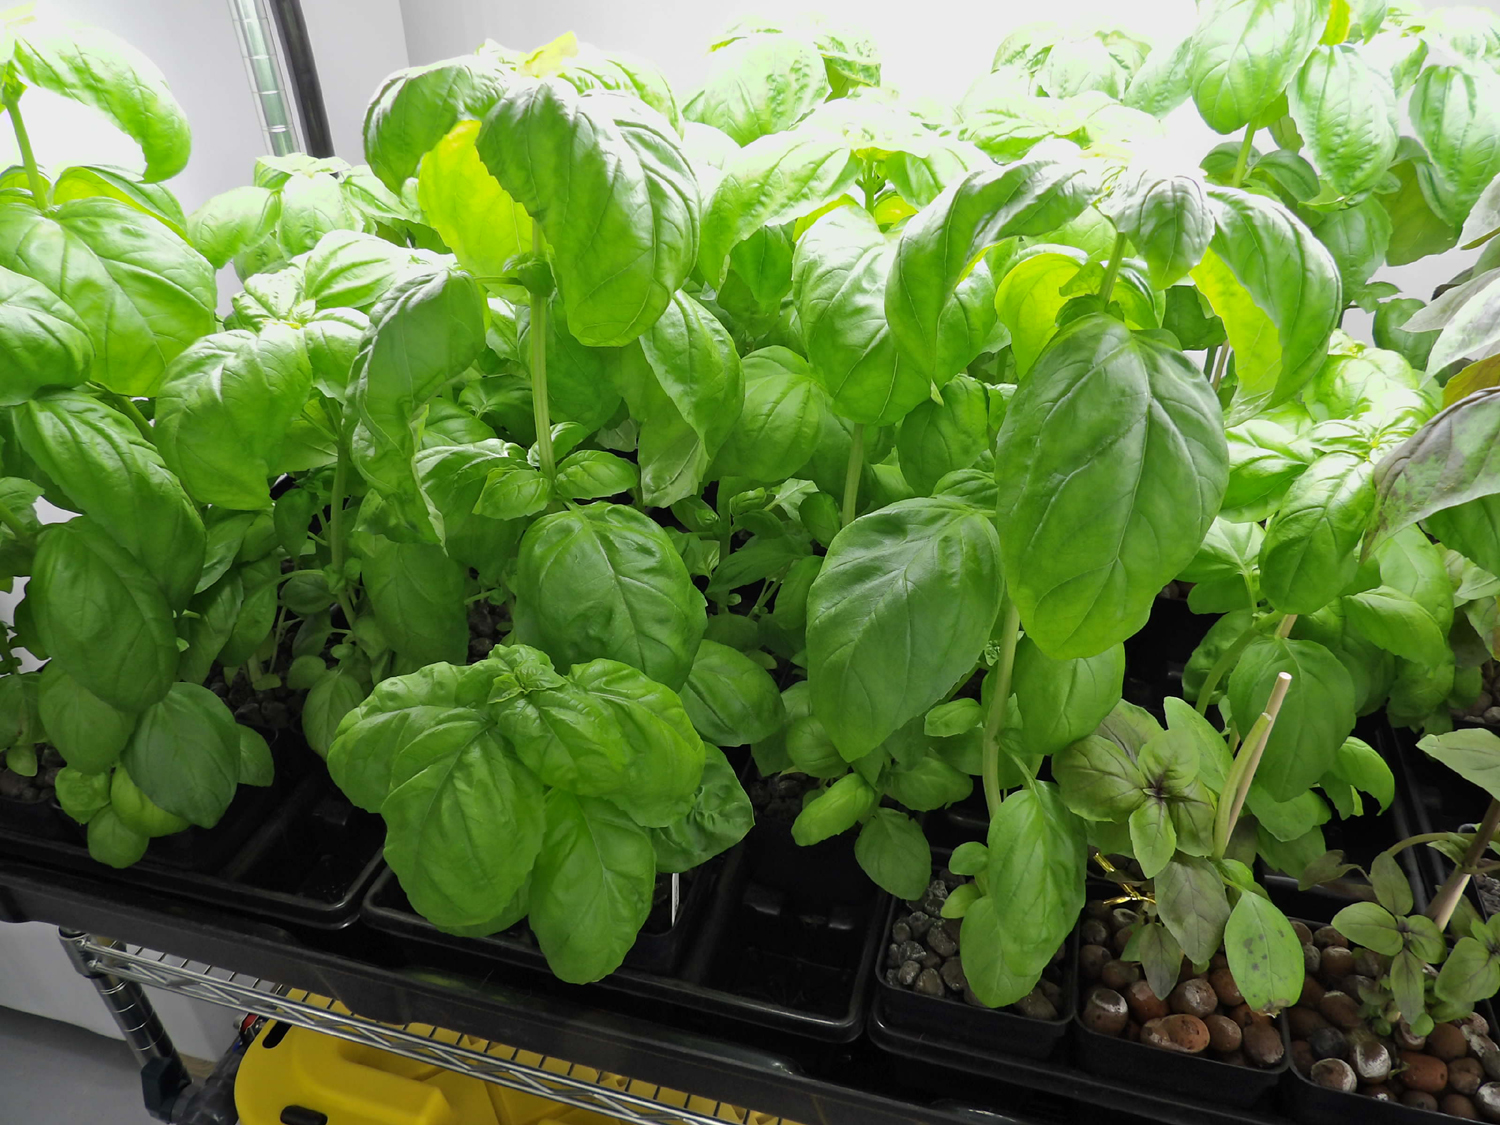
Seedlings of different leafy vegetables/herbs (basil, Ocimum basilicum; chard, Beta vulgaris; parsley, Brassica oleracea; red kale, Petroselinum crispum) and fruit crops (bell pepper, Capsicum annuum; cherry tomatoes,Solanum lycopersicum; cucumber, Cucumis sativus; squash, Cucurbita pepo) were grown in 2” jiffy pots during the month of May, 2012. One-month-old, fully developed seedlings were transplanted in the test plot and aeroponic growing systems (Tower Garden by Juice Plus+ aeroponic growing system, Collierville, TN, USA). Seventy-two seedlings of each leafy vegetable and twenty-four seedlings of each fruit crop were planted on 24 Tower Garden aeroponic systems and in the test plot. The experimental site was located at the field cultivation facility of the National Center for Natural Product Research, Research Institute of Pharmaceutical Sciences, School of Pharmacy, The University of Mississippi. All the Tower Gardens and test plot were kept close to each other to provide similar environmental conditions. Nutrient solution was delivered to each Tower Garden by hand 1-2 times per week as required to keep the volume in the tank between 15 and 20 gallons. The electrical conductivity and pH of nutrient solution in Tower Garden were measured everyday and maintained within the range throughout the experiment. The plants were harvested as the edible produce achieved the earliest harvestable stage. The products of Tower Garden and field grown crops were evaluated and compared for total yield, phenolics, flavonoids, and antioxidant activities using cellular antioxidant (CAA) and 2,2-diphenyl-1-picrylhydrazyl (DDPH) assays.
2.2. Measurement of Yield
Fresh weight of each harvest was measured until the final harvest and the total yield was calculated at the end of the season for each crop. Based on the total yield, the number of plants propagated, and the number of fruits produced, the average yield per plant, the average number of fruits per plant, and the average fruit weight were calculated for each crop grown on the Tower Garden aeroponic systems and in the field.
2.3. Collection of Samples
Eighteen samples (nine from aeroponic growing systems and nine from the field, 200–400 g each) of each crop were collected for antioxidant analysis, and determination of total phenolic and flavonoids content. Freshly harvested plant material was collected and placed in the container containing dry ice. Immediately after the collection, plant material was brought to the laboratory and stored at −80°C until further use. All the samples were then freeze-dried and ground using a planetary ball mill (PM-400, Retsch, GmbH, Germany) at a low temperature. Out of nine, three randomly selected freeze-dried, powdered samples of each crop from Tower Garden and field were used for further extraction.
2.4. Extract Preparation for Total Phenolics, Flavonoids, and Antioxidant Properties
Dried plant material (10 g) from each sample was used for the preparation of extract. Samples were extracted with 75 mL (95% v/v) ethanol at 40°C for 10 min; the extraction process was repeated thrice. The solvent was evaporated at 40°C under a reduced pressure. The dried extract was used for further analysis.
2.5. Determination of Total Phenolic and Flavonoids Content
2.5.1. Reagents and Chemicals
Folin-Ciocalteu reagent, gallic acid, and quercetin standards were obtained from Sigma-Aldrich Co. (St Louis, MO, USA). Aluminum chloride hexahydrate, methanol, and sodium carbonate were obtained from Fisher Scientific (Fair Lawn, NJ, USA). Water was purified using a Milli-Q system (Millipore).
2.5.2. Sample Preparation
About 10–50 mg of the extract was dissolved in 5 mL methanol and sonicated for 45 minutes at 40°C followed by centrifugation at 1,000 ×g for 10 min. The clear supernatant was collected and stored in an amber bottle for analysis.
2.5.3. Total Phenolic Content
The total phenolics of the extracts were determined using the Folin and Ciocalteu reagent, following the method described by Singleton and Rossi [20] with slight modifications. Sample and standard readings were made using a spectrophotometer (Cary 50 Bio UV-Vis Spectrophotometer, Varian) at 765 nm against the reagent blank. The test sample (0.2 mL) was mixed with 0.6 mL of water and 0.2 mL of Folin-Ciocalteu’s phenol reagent (1 : 1). After 5 min, 1 mL of saturated sodium carbonate solution (8% w/v in water) was added to the mixture and the volume was made up to 3 mL with distilled water. The reaction was kept in the dark for 30 min and after centrifuging the absorbance of blue color from different samples was measured at 765 nm. The phenolic content was calculated as gallic acid equivalents GAE/g of dry plant material on the basis of a standard curve of gallic acid (5–500 mg/L, , ). All determinations were carried out in triplicate.
2.5.4. Total Flavonoids Content
The aluminum chloride colorimetric method was used for the determination of the total flavonoid content of the sample [21–24]. For total flavonoid determination, quercetin was used to make the standard calibration curve. Stock quercetin solution was prepared by dissolving 5.0 mg quercetin in 1.0 mL methanol, then the standard solutions of quercetin were prepared by serial dilutions using methanol (5–200 μg/mL). An amount of 0.6 mL diluted standard quercetin solutions or extracts was separately mixed with 0.6 mL of 2% aluminum chloride. After mixing, the solution was incubated for 60 min at room temperature. The absorbance of the reaction mixtures was measured against blank at 420 nm wavelength with a Varian UV-Vis spectrophotometer (Cary 50 Bio UV-Vis Spectrophotometer, Varian). The concentration of total flavonoid content in the test samples was calculated from the calibration plot (, ) and expressed as mg quercetin equivalent (QE)/g of dried plant material. All the determinations were carried out in triplicate.
2.6. Determination of Antioxidant Activity
The extracts were dissolved in dimethyl sulfoxide (DMSO) to make a stock solution of 20 mg/mL. The antioxidant activity of the extracts was measured at a concentration of 500 μg/mL by following two methods.
2.6.1. 2,2-Diphenyl-1-picrylhydrazyl (DPPH) Assay
The capacity of plant extracts (500 μg/mL) to directly react with and quench free radicals was evaluated as described earlier [25]. A stock solution of DPPH (200 μM) was prepared in ethanol. The assay was performed in 96-well plates. The reaction mixture, containing 100 μL of DPPH and 100 μL of the diluted test sample, was incubated at 37°C for 30 min. The absorbance was measured at 515 nm. Gallic acid was used as a positive control. Percent DPPH radical scavenging activity was calculated as follows:
Gallic acid showed 95% radical scavenging activity at 20 μM.
2.6.2. Cellular Antioxidant Activity Assay (CAA Assay)
The cellular antioxidant activity was measured in HepG2 cells as described by Wolfe and Rui [26]. The method measures the ability of phytochemicals in the plant extracts to prevent intracellular generation of peroxy radicals in response to ABAP (used as a generator of peroxyl radicals). The CAA assay is a more biologically relevant method than a chemical assay because it represents the complexity of biological system and accounts for cellular uptake, bioavailability, and metabolism of the antioxidant agent. HepG2 cells (acquired from American type culture collection, ATTC, Rockville, MD) were grown in DMEM supplemented with 10% FBS and antibiotics (50 units/mL penicillin and 50 μg/mL streptomycin). For the assay, cells were seeded in the wells of a 96-well plate at a density of 60,000 cells/well and incubated for 24 hrs. The medium was removed and cells were washed with PBS before treating with the test sample (500 μg/mL) diluted in the medium containing 25 μM DCFH-DA for 1 hr. After removing the medium, the cells were treated with 600 μM ABAP and the plate was immediately placed on a SpectraMax plate reader for kinetic measurement every 5 min for 1 hr (37°C, emission at 538 and excitation at 485 nm). Quercetin was used as the positive control. The antioxidant activity was expressed in terms of CAA units. The area under the curve (AUC) of fluorescence versus time plot was used to calculate CAA units as described by Wolfe and Rui [26]:
Quercetin showed CAA unit of 60 at 16 μM. This indicates that quercetin (at 16 μM) caused 60% inhibition of cellular generation of peroxyl radicals in HepG2 cells.
2.7. Statistical Analysis
All the experiments for determination of total phenolics, total flavonoids, and antioxidant properties using DPPH and cellular antioxidant assay (CAA) were conducted in triplicates. The values are expressed as the mean ± standard deviation (SD). Average crop yield was calculated by dividing total yield by number of plants grown. The statistical analysis of the results was done by agricolae module using -statistical software package version 2.2.1 ( foundation for statistical computing, Vienna, Austria) [27]. Analysis of variance and significance of difference among means were tested by one-way ANOVA and least significant difference (LSD) on mean values. Correlation coefficients () and coefficients of determination () were calculated using Microsoft Excel 2007.


